Pages

Showing posts with label Line Graph. Show all posts

Wednesday, 16 November 2016

Line Graph - Weather In Auckland


L.I To accurately interpret data
L.I To accurately present data

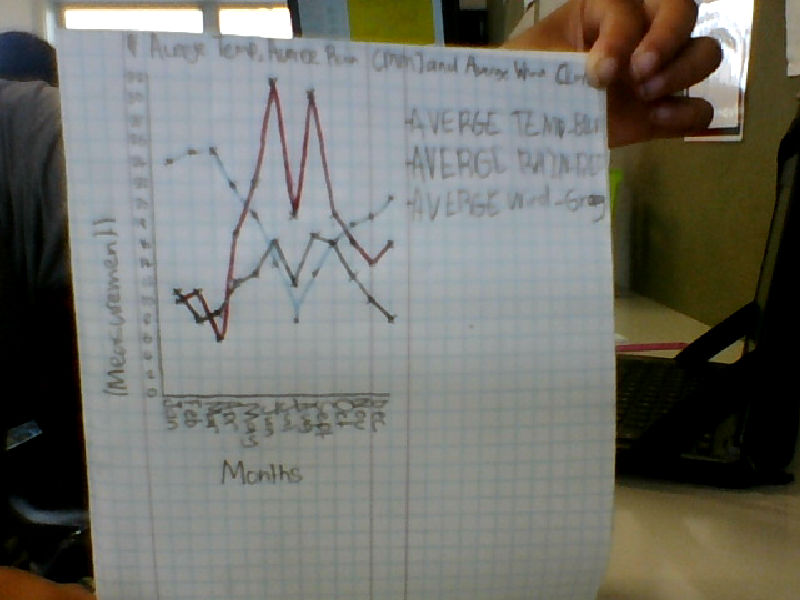
This week for our Maths task was we had to create a line graph on a spreadsheet digital and create one on our maths book by hand about the weather in Auckland. We also had to make a probability interpretation statement. So the probability of getting sunburn on December is very high because the tempature is 32 which is quite big. I learnt what the word probability means. It means the possibility of something happening or being true. I was a bit struggling on drawing the graph by hand but I stall managed to draw it (yey!). I think for next time I should draw my graph that I drawed by hand proply and neat.

Tuesday, 15 November 2016

Line Graph


L.I To accurately interpret data
L.I To accurately present data
This week for maths we had to make a line graph showing the average weather in Auckland (fake not real). We had to use spreadsheet to to create our graph and also had to do by hand so we had to draw as well. If the 2 line graphs weren't the same that's mean we did it wrong. We also learnt a new world which is called probability. With that word we had to make a interpret statement. The probability of wearing a singlet and getting sunburn on December is very high because the temperature reaches out to 32 which is quiet big.I learnt how to accurately interpret data and accurately present data. I was a bit struggling on writing the line graph by hand but I stall managed to draw it. I think for next time instead of doing a graph on weather in Auckland I should do a graph on who they wanted to be  

Average Weather In Auckland - Line Graph