As part of our math task we created a bar graph about how many blog post we have posted every year. We called it Blog Post Record. I have worked digitally for 5 years and have posted 674 blog post. In my first years (which was 2014) I post 7 post. The reason why is because it was my first time using Chromebook and It was difficult using and creating DLO's. In 2015 I improved a lot. I posted 66 blog post. I posted this much because I got use to using Chromebooks and I loved creating DLO's. So I had a lot to post on my blog. I think past the previous years I improved a lot. My goal is to post 5-10 post a week and by the end of the year I want have 300 more posts. I think I will achieve this goal if I put a lot of effort into my learning.
Showing posts with label Statistical Inquiry. Show all posts
Showing posts with label Statistical Inquiry. Show all posts
Friday, 9 February 2018

Thursday, 22 June 2017
Statistical Investigation Pie Chart - Bio-degrade
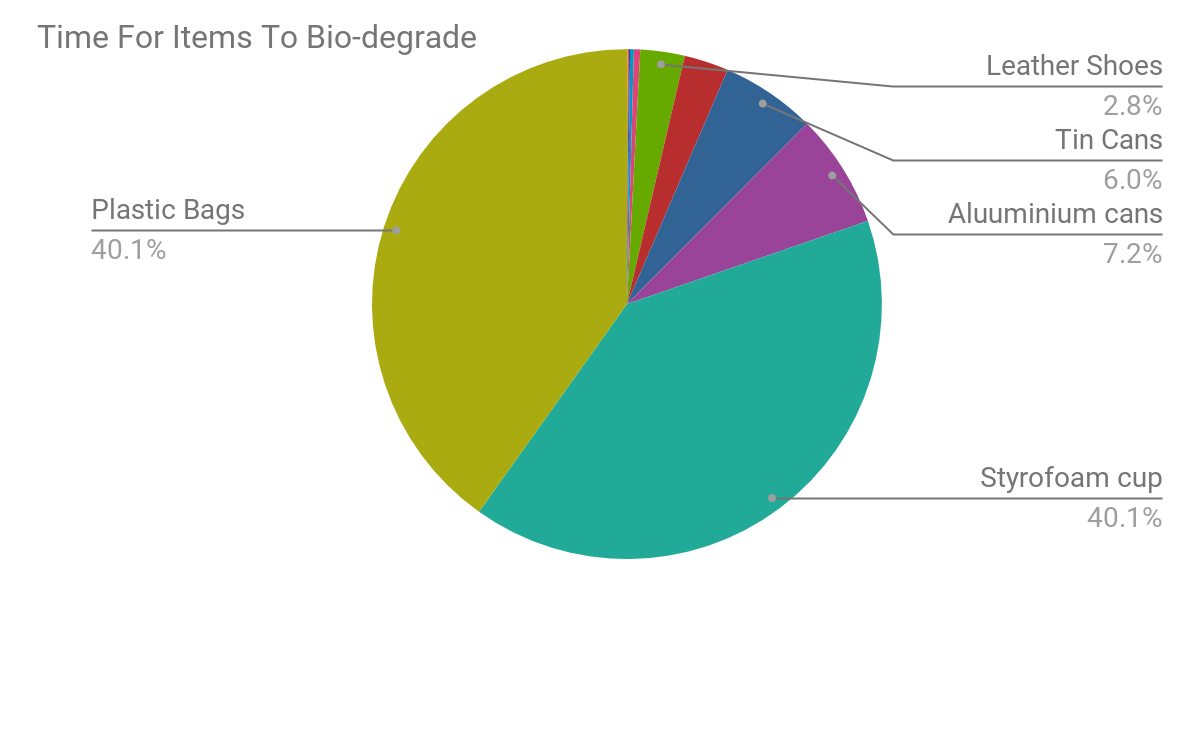
This pie chart shows you how many years it takes for these materials to biodegrade (break). I can tell by this graph that plastic bags and styrofoam take a really really long time until it gets destroyed. I can also see that vegetables take a really little amount of time to get destroyed or to dissapear.
Subscribe to:
Posts (Atom)